


This is how-to that shows the basics on adding parameters to charts in VCM Scanner V3. For this one we will add our Wideband reading.
THIS TUTORIAL ASSUMES YOU ALREADY HAVE YOUR WIDEBAND READING WORKING WITH DATA SHOWING IN THE "CHANNEL" LIST:
HOW TO: Setup Wideband / External sensor in VCM Scanner V3 (With PRO Interface)
--------------------------------
Adding your wideband reading to a Chart in Scanner V3
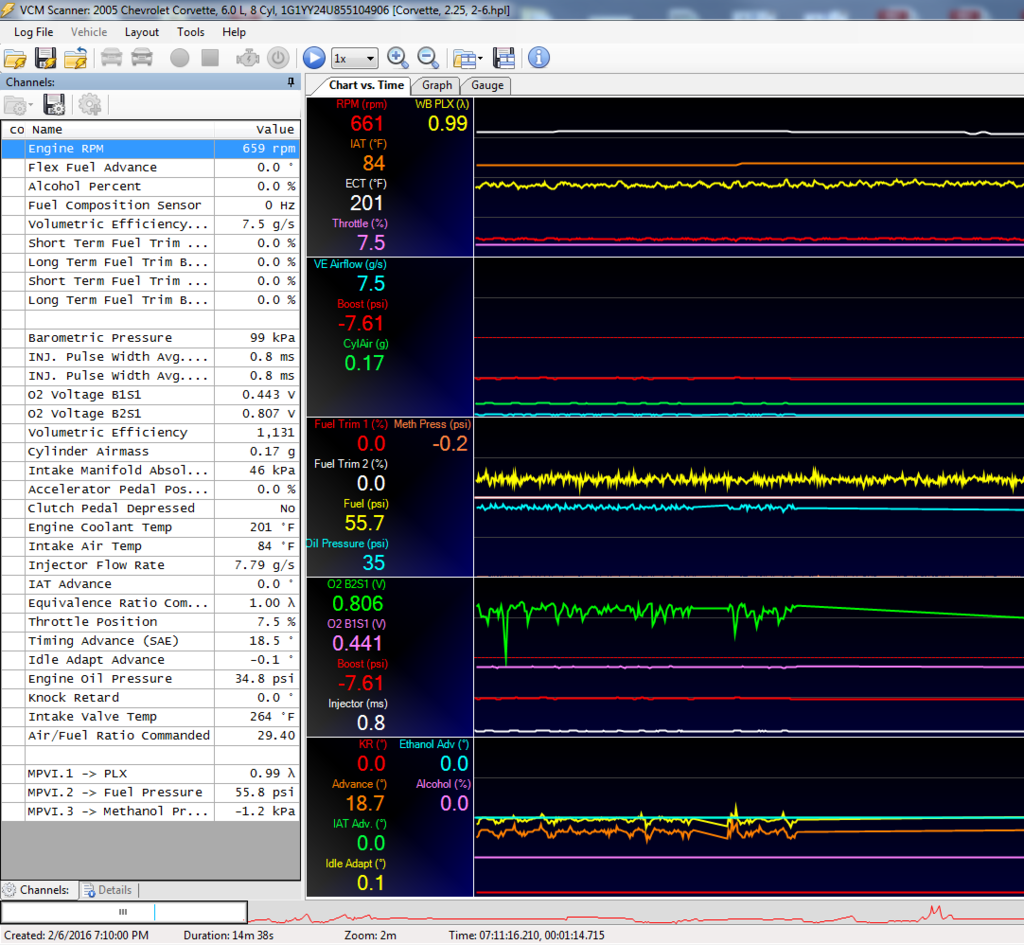
Step 1: Go to the "Chart vs. Time" tab. If you do not have a tab with this label, select Layout-->Add to Layout-->Chart vs. Time to add one
Step 2: Select the "Add Series" button on the top tool bar. It is the one with the green + symbol that only shows ONE graph in the icon
Step 3: You've created a new series..
Step 4a: Now lets give it a label. For this one, WB PLX (as I'll be using my PLX wideband)
Step 4b: Click on "click to insert or change" beside "Parameter:" This is where you define what you want to show up on the chart
Step 5: In this list you have access to all of the parameters available to you. By default it will show EVERY parameter you could possibly ever log, regardless of whether it's something you CAN actually log. If it's not in your channel list then you can't log it.
Step 6: Here you can see just how many parameters there are.. we can make it easier!
Step 7: Select the gear icon with the green check mark. This will filter the list of available parameters down to ONLY what is actually usable based on your channel config. You can see the dramatic reduction in parameters in the list
Step 8: V3 Scanner also includes a really nice search feature. I typed in PLX and along with that and the filter button mentioned in step 7 you're down to only one possible option. Double click on it.
Step 9: You may or may not be asked about using a Generic Sensor--if you are asked, I recommend you use the Generic sensor by select "Yes, Sounds good!"
Step 10: Now we're back at the Chart Display. Notice that the "Parameter" is not selected as "EQ Ratio [Sensor]" which is the generic form of the lambda sensor. You'll also see a drop down box of different units.. you can change this to convert your WB reading into common units very easily.
Step 11: Now setup the rest of the graph. I set mine to 2 decimal places, 1.5 max (lambda, 0.5 min (lambda) and set the color to yellow because that's just what I'm used to
Step 12: Close out that window and start logging.. if all was done correctly then you're in business!


 Reply With Quote
