


This is meant to serve as a basic how-to for setting up Graphs in VCM Scanner V3. Specifically we will be concentration on a Graph that displays fuel trim values on a VIRTUAL VE Vehicle. This is slightly more difficult than a non-VVE vehicle.
---------------------------------
Adding a Fuel Trim graph on a VVE Vehicle:
I will warn you now that this is going to look like a lot of steps, but I'm putting every mouse click as a different step, so it's really not that much work. I can do this in under a minute after doing it a few times.
Step 1: Go to your "Graph" tab, right click and select "Graphs Layout". If you do not have a Graphs tab then go to Layout-->Add to layout-->Graph to add one to your layout
Step 2: In the Graph and Display Editor, Select the "Add Table" icon (click on + icon and then select Add tabl
Step 3a: Give the new graph a name. In this case we're going to do "VE vs. Fuel trims".
Step 3b: Click on "click to insert or change" beside "Parameter:"
Step 4: This brings up a list of things you can make show up in the graph. We want Fuel Trims..
Step 5: Fortunately HPT has a built in parameter in V3 that adds together LTFT and STFT, so that makes things easy. This is under Maths-->Fuel Trims, then select "LTFT + STFT". Double click on this.
Next is the part that most people get stumped on. It isn't hard, just follow the steps.
Step 6: Open up the tune for your VVE vehicle in Editor. Go to edit-->Virtual Volumetric Efficiency.
Step 7: The window that pops up is the Virtual Volumetric Efficiency Editor.
Step 8: On the left hand side of the table you will see where it says "Manifold Absolute Pressure (kPa)". CLICK on this and it will bring up an Axix Editor
Step 9: Here you can change the axis to meet your needs. This particular truck is an NA setup, so selecting the 10-105kpa default option works just fine. If you're going to be running boost but will be under 15psi, select the 10-210 kpa option. If you're just going for full ridiculousness, select the 10-315 option (good for 30psi of boost!)
Step 10: The previous drop down box automatically fills in the data in the "enter your new Axis" text box. You CAN change these manually but for most people the defaults work fine. Hit OK to save your changes.
Step 11: Now it's time to setup the RPM axis. Click on "Engine Speed (rpm)" at the TOP of the Virtual VE table and you will get this box. Same deal here.. using the default select whatever range works best for your setup. For me 400-6400 is all I need.
Step 12: Alright, here is your "VE" table with the column and row Axis setup how you want them. The reason we did all this was because we need those labels to use in Scanner so that column and row axis on out graph AND our VE table MATCH
Step 13: To copy the column axis, right click anywhere inside the VE table, select Column Axis and select "Copy Labels"
Step 14: Go back to the Graph Display Layout Editor window you left open in Scanner. Paste the Column Axis Values that you copied in Scanner into the "values" field under Column Axis
Step 15: And here is the result after you paste those values in the "values" section of the Column Axis
Step 17: Go back to the VVE Editor and right click again, select row axis, copy labels.
Step 18: Back to Scanner, paste these values into the "Row Axis" Values section like shown
Step 19: In the column axis section, click on "click to insert or change". Type RPM into the window that pops up, HIT THE GREEN CHECK MARK FILTER button, and you should only be left with one or two options. If you get a box about using a generic sensor, I would select yes.
Step 20: Here's what it should look like with RPM Parameter now setup properly
Step 21: Now click on "click to insert or change" for the ROW axis section. Type in Manifold absolute, hit the green filter button and that should filter it down to one or two. Double click, and hit Yes if you get a box about using a generic sensor.
Step 22: This is what you were going for. You have a PARAMTER that you want to log (at the top, LTFT+STFT), you have a COLUMN axis that matches your virtual VE table (RPM and the axis labels) and you have a ROW axis that matches your virtual VE table (MAP and axis labels)
Step 23: Fill in the other info, min, max, decimals, etc. as you see fit. This is what I usually use:
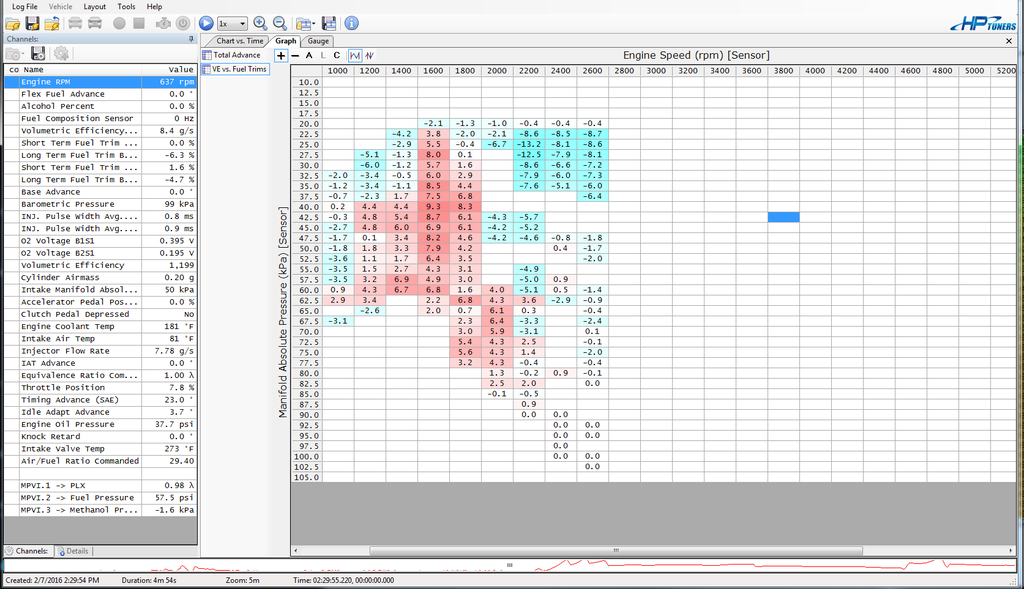
Finished Product: This is what it should look like when it's all said and done. Obviously this tune needs some work!


 Reply With Quote
